In 1975, there were six Chinese children for every pensioner. By 2035, there will be two Chinese pensioners for every child.
I pity that poor baby. When she grows up, either she will be burdened by an oppressive tax regime providing transfers for her older relatives, or she will be surrounded by an army of hungry poverty-stricken old people.
This grim vista is an inevitable consequence of the one child policy. The Chinese call it the 1-2-4 problem; in the future one child will have to look after two parents and four grandparents.
Yet from the perspective of today, China appears to be a very threatening prospect. It has grown at a fantastic rate, and now dominates world export markets. This future chinese demographic crisis is obscured by its astounding economic transformation.
Scratch the surface and China's success seems far from sustainable. It rests on three principles; and undervalued exchange rate, huge foreign direct investment inflows with its parallel inflow of technological know-how, and a huge pool of cheap labour arriving from the countryside and into the cities.
These three principles have produced economic benefits for ordinary Chinese. However, an even greater wave of benefits has flown out of China and into the West.
This economic success is also a huge subsidy from the Chinese people to the consumer-debt-serfs of North America and Europe. Chinese factory workers work long hours, for low pay, producing huge quantities of cheap goods. The Chinese ship them out at ridiculously low export prices, in return they receive dollars, euros, and sterling. The Chinese then lend this cash back to us in order to supply the necessary cash to buy yet more cheap Chinese goods.
It is hard to see how that kind of scheme could keep the world economy ticking over for another 20 years. At some point, the Chinese will want more than nice colourful pieces of paper for their products. The continuation of this generous subsidy scheme is all the more improbable when one considers Chinese population dynamics.
Still, it was great while it lasted. For my part, I received a cheap iPod, a laptop, and a flatscreen TV. The thing I can't understand is what the Chinese child of 2035 is going to get out of it.
Friday, 31 December 2010
Intergenerational equality - what does it mean for the NHS?
According to the Social Issues Research Centre, the over 50s in the UK now own approximately 80 percent of the nation's wealth.
One must always be sceptical about assessments of wealth ownership. People are notoriously dishonest about declaring how much they have. Nevertheless, the number has a ring of plausibility about it. Assuming that it is true, it raises a troubling issue - intergenerational inequality.
If one respects property rights, one can only grumble quietly about the fact that a disproportionate share of wealth is concentrated in the hands of a minority of ageing hippies. Nevertheless, this group has a claim on the nation's income that goes beyond property, shares and bonds. This group is also making a pitch for a disproportionate share of future government expenditure.
Over the next 20 years, health and pensions expenditure will take up an increasing proportion of the government's budget. Both these items are essentially expenditures on the over 65s. As the UK ages, pensions and health expenditure, as a proportion of GDP, will reach astronomical levels. Based on our current system of free health care and comprehensive pension entitlements, this would imply a further intergenerational transfer from the young to the old.
Somehow, I can't see that happening. Sooner or later, taxpayers and by that I mean the young, will demand comprehensive reform of social expenditure. In fact, this process has already begun. By international standards, the UK pension system isn't terribly generous.
However, the NHS has managed to escape any substantive adjustment. For practical purposes, healthcare remains free at the point of delivery. Successive governments have tried to restrain expenditure by rationing and cost control efforts. These efforts have reached a logical limit. A horde of grey-haired chronically patients are about to swamp the nation's hospitals demanding free healthcare.
The demand for intergenerational equality will inevitably lead to the demise of the NHS in its current form. There is something rather ironic about that. It was an institution created on the promise of delivering equality. It will be also destroyed by the demand for greater equality.
Thursday, 30 December 2010
Come back MEW, the UK economy needs you.

The great engine of the British economy has slipped into reverse. Before the financial crisis, homeowners were pulling out about £12 billion a quarter in home equity loans. They used this cash to fuel a massive consumption boom that kept the economy growing at around 3 percent. Since the summer of 2008, homeowners have been paying down their loans by around £6 billion a quarter. So far, homeowners have paid off around £50 billion.
In terms of their economic impact, these numbers are very large. In the third quarter of 2010, these home equity repayments amounted to about 2.4 percent of post-tax personal income. Prior to the crisis, home equity withdrawals were equivalent to about 6-7 percent. In pure cash terms, this represents a net turn-around of £20 billion - almost 10 percent of post tax income.
This isn't how it is supposed to be. The Bank of England cut interest rates to discourage savings, and make it cheaper to homeowners to borrow money so that they could continue spending. So what went wrong? At least three things didn't go according to the script:
- First, home prices fell. This ate into home equity and limited the extent to which homeowners could use their homes as collateral.
- Second, banks were feeling vulnerable. They had too much exposure to potentially delinquent homeowners. They have cut credit lines and made it harder to obtain home equity loans.
- Finally, borrowers have become more worried about the future path of the economy. Even the most extravagent consumer-addled debt serf knows that it isn't a good idea to mortgage the house when the probability of losing your job has increased.
Taken together, these factors driven home equity withdrawal flows into reverse. One final dismal fact; home equity withdrawal has been negative for 10 straight quarters. This is the longest continuous period of negative numbers since records began in 1970.
Property Price Bonanza in Hull

How can a small town like Hull see home values go from £40k to almost £110k in the space of just over five years?
Same question; different town.....
Wednesday, 29 December 2010
Whatever happened to self certified loans?

UK banks seem to learn something about lending. It was a simple lesson, but costly one. When writing out a loan, it's usually worthwhile to check out the documentation offered by the borrower.
Waiting for the great default

What is the true meaning of this chart?
As the red line illustrates, the yield on a UK twenty-year government bond is around four percent. This means that private investors are prepared to accept a promise that the government will repay a loan in 20 years time in exchange for a four percent return a year.
At the same time, the government promised to pay generous pensions to the public sector. It will also maintain a comprehensive pension system for the rest of us. It has agreed to sustain a social safety net for the unemployed and those suffering from long-term illnesses.
It insists that it will keep a fully comprehensive and free National Health Service. It has also committed to honouring a mountain of PFI agreements under which the private sector built public sector infrastructure in return for long-term service contracts.
I could go on, but the key point is that previous governments have promised away decades of tax revenues.
It's impossible to see how all these commitments can be honoured at the same time. The yield on government bonds reveals no such doubts. The UK bond market doesn't appear to be worried by all those years of extravagant promises.
There can be only one way of reconciling that contradiction. Bondholders are convinced that they will be repaid, which means they also believes that the government will renege on all those other commitments. For future generations, there will be no generous pensions, unemployment benefits, or free health services.
The government is going to default, but it won't be on its outstanding stock of bonds. It is going to default on the commitments it gave to us.
Tuesday, 28 December 2010
Ireland and her growing fiscal deficit

In the late 1990s Ireland was one of the most fiscally prudent countries in Europe. It regularly recorded budget surpluses.
However, no one was watching over the banks. Throughout the last decade, Ireland's financial sector made appalling loans to property speculators and other folk of an unsavoury nature. Now, those loans can not be paid back.
Rather than passing losses onto the bank's creditors, who foolishly financed this farrago, the Irish Government decided to place the burden for paying for this disgraceful speculation on the poor taxpayer. While the government is raising taxes, cutting services and reducing the public sector salaries, it is also taking on defaulted loans so that French and German banks don't have to reduce their dividends to their shareholders. If a government runs that kind of economic policy, it will quickly accumulate a 32 percent of GDP budget deficit.
Ironically, Ireland's mortgage holders continue to service their debts. Arrears are running at about 5 percent. That is a little higher than the UK, but given that the Irish economy has imploded, it is surprising that the default rate hasn't risen higher.
UK House Prices - Four reasons to think the UK property market might be weakening
Hometrack has just released its December survey of estate agents and surveyers. The data points to a weakening UK property market.
Reason One: Average Time on the Market is increasing

Housing inventory is taking longer to sell. The average time taken to shift a home increased over the month to 10 weeks, the longest period since April 2009.
The time on the market is now over 3 months for three regions - East Midlands, North West and Wales.
Reason 2: Settlement Prices are falling relative to asking prices

Sellers are offering sizable discounts on property. Settlement prices as a proportion of asking prices fell to 92.1 percent. This is a 16 month low.
The recent weakening was driven by declining demand. Hometrack estimate that in December demand fell by 4.8 percent, the sixth monthly decline in a row. Supply also contracted slightly, falling 1.5 percent.
Looking beyond December, 2010 was marked by a sharp increase in inventory. Hometrack estimates that the supply of homes for sale grew by 24 percent. In the final 6 months of the year, demand fell by 18 percent.
Reason 3: Prices are falling in around a third of the country

At the beginning of the year, hardly any post codes were registering price declines. Markets were either standing still or moving upwards. Things began to change rapidly over the late summer months.
Reason 4: The number of post codes registering a price increase has fallen to zero.

According to Hometrack, there are no "hot" markets.
Hometrack also presented an unusually pessimistic projection for next year. They expect house prices to fall by two percent.
Monday, 27 December 2010
Drug offences go up, burglary goes down

This is a "man bites dog" chart.
The prevailing myth is that drug use is associated with crime. Moreover, the drug users speciality is burglary. If only drugs were legal, users wouldn't have to commit crime, especially burglary.
The data, however, doesn't want to sing that song. Since 2003, drug offences exploded. At the same time, burglary offences fell. Thus, it would appear that legalisation of drugs isn't the only route to lower crime.
There are a couple of ways to explain the paradox:
- Target the drug offence, tackle the crime - Perhaps the data is tell us that the Police should target drug offences. Finding a smackhead with a few crumbs of Class A is easier than catching them breaking and entering.
- Misreporting - Crime data has become totally politicised. The police have a strong incentive to register declines in key crime categories.
- Lower drug prices reduce crime - Another possibiity is that lower prices of drugs reduces the need to commit crime. Previously, it might have taken two criminal offences to secure a given amount of drugs; now it only takes one.
Personally, I like the first explanation, but that might be because of my deep rooted antipathy to drug takers.
The main takeaway from this chart is that the relationship between drugs and crime is much more complicated than it seems.
Sunday, 26 December 2010
Inflation - the lights are beginning to flash

Back in the summer of 2009, inflation across Europe seemed very subdued. All but four of the EU27 had an inflation rate of 2 percent or less, marked by a green light.
Deflation was the fear. Europe was in danger of falling prices. What could be worse than paying less for something this year compared to last year?
Things are beginning to change. Virtually all of the EU membership is beginning to see rising prices. In the chart, inflation rates between 2 and 3 percent are marked by a yellow light. Red lights signify an inflation rate of greater than 3 percent. The yellow lights started illuminating in early 2010. As the year progressed, red lights have begun to flash.
The UK has been a top inflation performer. The rate was consistently above 3 percent for the whole of 2010; a recored equaled by only Hungary and Romania. Even Greece managed to get their rate below 3 percent for two months this year.
UK Economy - The ten hottest property markets in London

I have no explanation for this chart; I am not even going to try to understand what is going on.
I will merely report that at in the twelve months up to October at least 10 London boroughs property prices increased by at least 10 percent.
Am I disappointed? You could say that.....
UK Economy - Should I sell or hold out?

"Should I sell or hold out for more" - this is the terrible dilemma facing anyone trying to sell something.
The chart above reeks of seller angst. In the immediate post-crisis period, sellers were desperate. Prices were collapsing, credit was tight, and the economy was tumbling into the longest recession this side of the second world war. Settlement prices fell from 93 percent of the asking price to 88 percent. On average, sellers were offering a 12 percent discount on estate agent window prices.
By the middle of 2009, sellers started to calm down and slowly the ratio of settlement to asking price began to increase. Unsurprisingly, this coincided with a recovery in prices.
But what is happening now? Since the summer, the ratio has started to slip south. Is this something seasonal, or is the housing market starting to weaken again?
Friday, 24 December 2010
UK Economy - Housing heat map

(Click on the graphic for a larger version)
This is a house price heat map for the South West of England.
The blue areas indicate towns and cities where house prices have been falling. The darker the area, the deeper the price cuts. The red areas indicate rising prices; the deeper the red, the faster the house price growth.
So what is the housing heat map telling us about property developments in the South West?
- Prices were falling rapidly in throughout most of 2009.
- The market began to turn in the summer.
- By early 2010 virtually all the towns in the region were experiencing positive price increases.
- Prices heated up during the summer of 2010.
- More recently, the market appears to be cooling again.
Corporate Responsibility from an Irish Bank
The Irish government has just poured another €3.7 billion into one of the country's largest bank - Allied Irish Banks (AIB). The move effectively nationalizes the institution. The government now owns four out of six of the country's largest banks.
The Irish government took over AIB because it was close to having insufficient capital to cover its appalling losses. Without additional funding from the government, AIB risked breaking the rules governing its banking licence.
The Irish banking system is unrelenting financial disaster. It has imposed upon the Irish taxpayers horrific losses, that will take generations to pay off. So with those devastating losses in mind, I checked out AIB's corporate social responsibility website. Here is taster of the site's contents:
Being a responsible corporate citizen is very important to AIB, wherever we operate. We place the core values of honesty, integrity and fairness at the centre of our relationship with our customers and stakeholders. Our CSR practices support these values and we aim to follow best industry practices.
We have a long term commitment to CSR and look forward to the challenges and opportunities it presents for our staff, customers, shareholders, business partners and the communities in which we operate.
The site defies parody.
All the weasel words that have infected modern business practices are there:, integrity, values, fairness, relationship, stakeholders. There is even a page on the environment. Yet here is bank whose business decisions wrecked an economy, improvished a people, and rendered their government insolvent.
What should have been the true corporate social responsibility of AIB? It was to be a prudent and well run bank - no more, no less.
There was no need to mouth empty platitudes about a "committment" to "honesty". AIB would have discharged its social responsibilities fully if it had extended loans to viable businesses, given mortgages to credit worthy individuals, paid its taxes fully, and made a profit for its shareholders.
UK House Prices - Property prices in Cornwall are up 169 percent

It is just another case of UK house prices being bid up by outsiders. People from the South West often complain that wealthy outsiders, especially from London, come into the area and bid up the property prices. The consequences are stark for low and middle income families who can no longer afford to own a house in their own neighbourhoods.
House price data from Cornwall seem to support the accusation. Since 2000, house prices in Cornwall have increased by 169 percent, far outstripping local incomes. Prices came down slightly with post-financial crisis correction. However, prices began to rise again in 2010.
Personally, I think Londoners should only buy houses in London. If they want to go there for a holiday, then they should stay in a bed and breakfast. Leave Cornwal alone.
UK Economy - Household bank deposits shrink

Negative real interest rates have destroyed any incentive to use the UK banking system as a means of saving. Near zeri rates gave ensured that household checking deposits are declining, while the growth of time deposits has fallen sharply.
At first glance, this may not seem much of a problem. After all, the Bank of England wanted the nation's households to go out and spend. Higher savings rates means lower consumption and lower output.
However, the Bank of England also wanted commercial banks to find more stable sources of financing. The wholesale money markets have proved to be too volatile. Furthermore, UK banks have a large amount of funding maturing next year. Some banks may find it difficult to replace that funding at low interest rates.
Household deposits would provide a more stable alternative to flighty capital from the wholesale market. Unfortunately, householders need to receive a positive rate of return before they put money in a bank.
This is just one more reason why UK interest rates must rise.
Thursday, 23 December 2010
UK Economy - GDP growth revised downwards.

The UK economy isn't recovering as fast as initially thought. The ONS revised GDP figures for the third quarter downwards. Previously it had reported a growth rate of 0.8 percent. Now, the ONS thinks that the economy grew by 0.7 percent.
However, the composition of growth is the real story. It is rather lopsided. As the chart above illustrates, construction is booming. It is doing all the heavy lifting in terms of pushing GDP upwards. Moreover, it has exceeded the levels recorded in 2006. Why construction should have picked up so suddenly is a bit of mystery to me.
In contrast, the service and production sectors have increased only marginally. The lack of a recovery in the production sectors is particularly worrying. Since the crisis began, production is down by around 10 percentage points.
The bubble is back in town
Today, Bloomberg reported that commercial property in London is booming. Citing data from Real Capital Analytics (RSA), sales of existing commercial property in the U.K. capital totaled $13.9 billion in the first nine months of this year.
Dan Fasula, Managing Director of RCA was ecstatic:
"There’s a massive surplus of investment capital looking for a home, and the one thing in common is a desire for yield. London office property at a 5 or 6 percent yield looks fantastic against the alternatives. Negative real interest rates mean you aren’t going to buy government bonds, corporate bonds have already had an incredible rally, gold doesn’t give you a yield and the stock market is volatile."
To be fair to Dan, what he says makes sense. If the Bank of England engineers a situation where interest rates on government bonds and bank deposits are negative, investors will seek returns elsewhere. If, as Dan suggests, commercial property is yielding five or six percent, then the commercial property market will start a bubble.
The sad fact is that Britain, and the investors it attracts from abroad, are hopelessly addicted to property speculation. I used to think the recent crash in prices might provide an antidote, but I was wrong. The crash is merely a precursor to another bubble.
While I can't share Dan's excitement I suspect he might be telling us something quite important.
UK house prices - Cardiff property market - flatlining since 2004

The property price chart for Cardiff is quite strange.
The data suggests that prices have flatlining since 2005. During the first half of the decade, Cardiff enjoyed a robust housing bubble. After 2005, the bubble seems to have petered out.
The red line represents the underlying trend in prices. The trend tracks the series quite closely for the first five years, then prices hop around a flat trend.
These prices are not adjusted for inflation. Therefore, the data would imply that in real terms housing prices in the Welsh capital has been falling.
If only this were true of more cities in the UK.
(The data source is Acadametrics, which uses Land Registry prices).
Wednesday, 22 December 2010
Ernst and Young targeted in the first Lehman court case
Lehman is a name we would all like to forget. When it failed in September 2008, it nearly destroyed the global financial system. Looking back, doesn't it seem strange how quickly one of the giants of Wall Street came crashing down?
New York prosecutors have been asking that same question. They seem to have arrived at a tentative answer - Lehman's reported balance sheet was a sham. Since balance sheets should be audited correctly, prosecutors have pointed the finger at Lehman's auditors - Ernst & Young.
New York attorney general Andrew Cuomo has filed a lawsuit against the accounting firm. The civil fraud case claims that Ernst & Young did nothing except book handsome fees while Lehman used accounting gimmickry to mask its rotten balance sheet.
The lawsuit says Lehman was "a massive accounting fraud". This is strong language which begs the question why haven't any former top executives at the investment bank also been indicted.
The core of the case is centered on the infamous Repo 105 transaction. Lehman used this concocted "sale and repurchase" agreement to move $50 billion off its balance sheet. This allowed Lehman to temporarily to show investors it wasn’t carrying too much debt.
The lawsuit is looking to pull more than $150 million in fees from Ernst & Young, which were received from 2001 to 2008 as Lehman's outside auditor.
House prices UK - Brighton, London by the sea with property prices to match

London properties and their price tags are shocking. But does Brighton offer the charm of London at lower prices? Brighton is of course London by the sea. It is so nice that the electorate actually elected a Green party member of Parliament. Its charm is fully reflected in its outrageous property prices. The average house will set you back close to £300,000.
Like everywhere else in the UK, Brighton property prices took a hit after the financial crisis. They have, however, recovered rather quickly and appear to have made up virtually all the losses inflicted in 2008.
More scary UK fiscal numbers
These days, I get very nervous when the public sector statistics are about to be published. I keep hoping to see some limited progress towards reducing our mammoth fiscal deficit. Unfortunately, the numbers continue to disappoint.
The data for November were particularly bad. In one single month, the government ran up a deficit of £23.3 billion. To give that number some context, the government collected £36.7 billion. So, for every one pound raised in taxes, the government borrowed sixty-three pence.
That is a fearful rate of debt accumulation. Since April this year, the government has piled on an additional £100 billion in new debt.
So far, the UK haa avoided the sticky fate of Ireland and Greece. This is in large part due to the post-election budget that has, for the moment at least, convinced financial markets that they should continue funding the government's gargantuan borrowing requirement.
However, the commitment to deficit reduction has to manifest itself in the fiscal numbers. We need to see a lower monthly deficits as soon as possible.
Tuesday, 21 December 2010
Where have all the young ones gone?

Twenty years ago, one mortgage borrower in five was under 25. Today, that number has fallen to little over one in sixteen.
The vast majority of young people simply can not afford to buy property. Instead, the housing market has become the domain of the middle aged and retired.
I suspect that this exclusion will have dire consequences for the current beneficiaries of the UK housing scam. Those property-liberated youngsters will soon be the backbone of the UK tax base. I wonder whether today's under-25s will be willing to hand over a large part of their earnings to finance the pensions of undeserving property owners.
Methinks not.
UK house prices - Why would anyone want to live in Hackney?

Call me a snob if you like, but I have never understood why people would want to live in Hackney. I can understand why one might have to live there, but choosing Hackney over any other borough in London? That, I am afraid, I have difficulty comprehending.
My personal prejudices are not reflected in Hackney's house price to earnings ratio, which doubled in 9 years. The ratio has retrenched slightly with the collapse of the bubble. Nevertheless, the ratio is hovering around 8, which seems extraordinarily high for what was once the poorest neighbourhood in London.
Perhaps I am wrong about Hackney. If so, what am I missing?
UK inflation expectations continue to rise
Last week, the Bank of England published the latest quarterly survey of public attitudes to inflation. It wasn't good. People seem to be bracing themselves for higher prices next year.
Here are the main highlights from the survey:
Here are the main highlights from the survey:
- When asked to give the current rate of inflation, respondents gave a median answer of 3.9 percent, compared with 3.6 percent in August.
- Median expectations of the rate of inflation over the coming year were 3.9 percent, compared with 3.4 percent in August.
- When asked about expected inflation in the twelve months after that, respondents gave a median answer of 3.2 percent, compared with 2.9 percent in August.
- When asked about the future path of interest rates, just over half of respondents expected rates to rise over the next 12 months.
CBI expects higher inflation next year
Yesterday, the CBI released its economic forecast for next year. This is what they said about the prospects for inflation:
"The CBI expects inflation throughout 2011 to be higher than previously forecast, reflecting greater inflationary pressure from energy and commodity prices. CPI inflation will significantly exceed the Bank of England’s 2 percent target in 2011 for a second year, mainly due to the impact of higher VAT. This upward push to inflation will end by Q1 2012, when inflation is forecast to dip just below target before ending the year at 2.4 percent."
Time for a rate hike, perhaps?
Monday, 20 December 2010
Government bond yields - should we worry?

Since early October, the yield on 10 year UK government bonds has crept up 73 basis points. That is equivalent to three typical hikes of the Bank of England's bank rate.
Should we worry? Have financial markets finally realized that the government may have difficulties in repaying the huge amounts of debt it has issued since the financial crisis began?
There are at three reasons for taking a calm and measured approach to rising bond yields:
- Yields were higher earlier this year - In February, the yield hit 4.23; currently the yield stands at 3.69. Back then the investors were worrying about an election, and the possibility of a renewed Brown mandate. As the election approached, investors calmed down as New Labour's poll numbers declined.
- The government has announced a fiscal consolidation plan - The coalition has what appears to be a credible plan to reduce the deficit. It is also prepared to enact difficult measures, such as hiking university fees, increasing the coalition's credibility in terms of dealing with our huge fiscal difficulties.
- Rates need to rise anyway - If the UK economy is to return to anything looking like normality, then interest rates will have to rise, including bond yields. Therefore, the recent increase reflects better growth prospects and a move towards stability. As such, we should welcome this modest upward shift in yields.
If inflation were to pick up further, then yields would begin to pick up extremely rapidly. Financing new government debt will become more expensive. If yields increase dramatically, then the government's fiscal reduction strategy may be in jeopardy. There would also be negative effects on private consumption and investment.
An early hike in the bank rate would go a long way to reducing these concerns. It would send a signal that the MPC will tackle any inflationary pressures. It would also signal that the UK economy has started to take the first tentative steps towards the exit in terms of the financial crisis.
Unfortunately, the MPC have one eye on the large rollover problems that UK banks have to face next year and 2012. You see, it is always about the banks. The UK economy would benefit from a rate hike, but that banks would be squeezed.
In any choice between the interests of financiers and and the rest of us, the financiers always seem to win.
Homeless in California
I found this youtube clip quite distressing. It is an interview of a young homeless man in California.
Estimates for the number of homeless in America vary depending on whether the measure is taken on a single night or covers an entire year.
Using the "single night" methodology, a U.S. Department of Housing and Urban Development report estimated that on a single night in January 2008, there were 664,414 homeless people. About 6 out of 10 were in some kind of homeless shelter; the remaining 4 out of 10 were living in the street or in another place "not intended for human habitation". About three-fifths of the homeless on a single night were homeless as individuals (62 percent), while two-fifths (38 percent) were homeless as part of a family.
Using the "in a single year" approach, about 1.6 million persons used an emergency shelter or a transitional housing program during the 12-month period between October 1, 2008 and September 30, 2009. This number suggests that roughly 1 in every 190 persons in America used the shelter system at some point during the year. Around a third are homeless within a family unit, with a million being recorded as "homeless individuals".
Since then, things could have only got worse....
It is tempting to fall back on stereotyping the homeless and placing the blame on the individual weakness, such drug or alcohol addiction or mental illness. However, here is a study, written in 2001, about the rise of the homeless in California. The paper concludes that it was largely housing affordability that explained the huge increase in homelessness:
Here is how the abstract of the paper put it......
It is generally believed that the increased incidence of homelessness in the United States has arisen from broad societal factors, such as changes in the institutionalization of the mentally ill, increases in drug addiction and alcohol usage, and so forth.
This paper presents a comprehensive test of the alternate hypothesis that variations in homelessness arise from changed circumstances in the housing market and in the income distribution. We assemble essentially all the systematic information available on homelessness in U.S. urban areas: census counts, shelter bed counts, records of transfer payments, and administrative agency estimates. We estimate similar statistical models using four different samples of data on the incidence of homelessness , defined according to very different criteria.
Our results suggest that simple economic principles governing the availability and pricing of housing and the growth in demand for the lowest-quality housing explain a large portion of the variation in homelessness among U.S. metropolitan housing markets. Furthermore, rather modest improvements in the affordability of rental housing or its availability can substantially reduce the incidence of homelessness in the United States.
This is shocking stuff for the richest country in the world; an army of homeless people, who for most part, are out on the street due to a dysfunctional housing market and stagnant real wages.
Sunday, 19 December 2010
Kensington and Chelsea - house prices are twenty times earnings

How high can the house price to incomes ratio go? The Kensington and Chelsea property market suggests that a double digit ratio is perfectly possible.
The Department of Communities and Local government produce a large dataset of average house prices to median incomes for towns and boroughs. (The median, you will recall, is refers to the middle of the data series. It means that half of all incomes are below the median and half are above.) The data is only collected on an annual basis. Nevertheless, it does produce some interesting pictures.
Lets start with the central London district of Kensington and Chelsea. The ratio of house prices to income hit 24 in 2008. One thing is for sure, local people weren't buying up those dinky little terraced houses in Fulham.
Time permitting, I am happy to post other local house price to earnings ratios, so long as the data is available. Contact me on ukhousebubble@aol.com
Friday, 17 December 2010
When empirical regularities won't do what you want them to do.
The Bank of England seem rather confused about the recent alarming surge in inflation.
Adam Posen was the latest member of the committee to articulate his confusion. Earlier this week, he gave a talk at the annual christmas breakfast of Essex Institute of Directors, which was held in the "charming" town of Billericay.
Mr.Posen explained why recent inflationary develops were no different from earlier times. He argued that four important "empirical realities" affecting inflation were still at work in the UK, despite the recent upheavals caused by the banking crisis.
Those regularities were:
In fact, downward pressure on prices is everywhere except in the data. Here, the inflation rate stubburnly refuses to adhere to Mr. Posen's empirical regularities.
So, where is the flaw in Mr. Posen's argument. I believe it is on this assumptions about the output gap. The UK was uniquely dependent on financial markets as a source of economic growth. The financial crisis has eliminated a key source of UK growth. More generally, the extended contraction in output has destroyed both human and physical capital, limiting the flexibility of the economy to jump back as aggregate demand picks up.
Therefore, the output gap isn't as wide as the Bank of England thinks. Competitive pressures in product markets are not that elevated, and firms can pass on the sterling depreciaiton and VAT hikes more easily into prices.
One final irony from Mr. Posen; he barely mentioned interest rates. The key policy instrument was only mentioned four times, and never in the context of a credible counter inflationary strategy.
Adam Posen was the latest member of the committee to articulate his confusion. Earlier this week, he gave a talk at the annual christmas breakfast of Essex Institute of Directors, which was held in the "charming" town of Billericay.
Mr.Posen explained why recent inflationary develops were no different from earlier times. He argued that four important "empirical realities" affecting inflation were still at work in the UK, despite the recent upheavals caused by the banking crisis.
Those regularities were:
- Unemployment affects inflation at 1-2 Year horizons:
- Large output gaps persist after financial crises:
- Private consumption contracts in the medium-term during fiscal consolidations
- Unit labour costs are a significant predictor of inflation
In fact, downward pressure on prices is everywhere except in the data. Here, the inflation rate stubburnly refuses to adhere to Mr. Posen's empirical regularities.
So, where is the flaw in Mr. Posen's argument. I believe it is on this assumptions about the output gap. The UK was uniquely dependent on financial markets as a source of economic growth. The financial crisis has eliminated a key source of UK growth. More generally, the extended contraction in output has destroyed both human and physical capital, limiting the flexibility of the economy to jump back as aggregate demand picks up.
Therefore, the output gap isn't as wide as the Bank of England thinks. Competitive pressures in product markets are not that elevated, and firms can pass on the sterling depreciaiton and VAT hikes more easily into prices.
One final irony from Mr. Posen; he barely mentioned interest rates. The key policy instrument was only mentioned four times, and never in the context of a credible counter inflationary strategy.
Running out of credit

In the aftermath of the financial crisis, consumer credit was regularly offered as one of the prime reasons behind the downfall of UK banks. UK consumers were encouraged to go on a plastic-fueled shopping spree that ultimately created a nation of debt-serfs, who couldn't repay the banks.
The story, however, was only partly true. Yes, consumers were crushed by high levels of debt, but no, the Banks hadn't been pushing individuals to over use their credits.
UK banks had become wary of consumer credit long before the credit crunch. Gross consumer lending peaked around seven years ago. Since then, banks have been quietly reducing the flows of new lending.
Banks engineered this contraction of credit by massively hiking interest rates on credit cards. You would have to be either mad or desperate to run a balance on card.
With default rates rising, banks had become wary of overextended maxed out consumers. Home equity loans and remortgaging, where consumers used their homes as collatoral, seemed a much safer proposition.
Ironically, the credit crunch has prompted banks to reverse their previous policy of reducing their exposure to consumers. For the last 18 months or so, gross consumer lending has been rising.
Thursday, 16 December 2010
Unemployment creeps upwards

The one thing that the UK must avoid is both high unemployment and increasing inflationary pressures. From a policy perspective, there are few viable options.
The UK may be heading in that direction. The inflation numbers, released yesterday, gave a stark indication that pressures were mounting. Today, the unemployment numbers ticked upwards, bringing the overall jobless rate to almost 8 percent.
The most striking thing about UK unemployment is that it seems to have been completely unmoved by the huge fiscal deficits and quantitative easing. The rate shot upwards during the autumn of 2008 and has remained high ever since.
Brown spent like a Prime Minister about to lose an election. The Bank of England, like the Greek God Atlas holding the world aloft, used their printing presses to prevent the UK banking system from collapse. Yet these herculean efforts had little practical impact on the labour market.
Defenders of the UK stimulus package and the monetary blowout will always argue that things would have been much worse without this emergency response. This is, of course, an unprovable counter-factual. What is clear is that the data provides little evidence that the mad policy blowout of 2008-9 had any practical benefit for the UK economy.
Athens on Fire
The Greek state is bankrupt. Its debt to GDP ratio is well over 100 percent. It cannot raise sufficient revenues to cover its expenditures. It is shut out of financial markets because it is no longer regarded as creditworthy.
The vast majority of Greeks fully understand the dire position of their country. There is, however, a minority who remain in denial. Today, they took to the streets, attacked the police, and terrorized their fellow citizens.
What do the demonstrators want their government to do? Print money to cover the massive fiscal deficit?
The Brown New Labour hiring boom is over

During the three months after the election, public sector sector employment decreased by 33,000. Although this may seem a large number, it shrinks into insignificance when compared to the overall level of public sector employment. As of the end of September, there were some 6 million on the public payroll.
The declines were as follows:
- Local government employment decreased by 18,000.
- Central government employment decreased by 12,000 (this includes the NHS, which is the largest single component of public employment).
- Civil Service employment decreased by 8,000 to 515,000.
Wednesday, 15 December 2010
Civil service pay

There are about 1,100 UK civil servants earning more than 100k a year.
There are 527,484 employed within the civil service, of which about 20 percent are part time.
The median civil service salary is about 23k.
The UK economy is operating close to full capacity
The November inflation numbers must have forced a cold shiver down the backs of many in the Bank of England. The Bank had been expecting a winter moderation of inflationary pressures. Instead, prices are rising far faster than anyone at the Bank had anticipated.
In a speech last week, Charles Bean, the Deputy Governor, said as much:
"While UK output growth has come in much in line with our expectations, the same cannot be said of our primary objective, inflation. Back in August of last year, our central projection was for CPI inflation to be around 1.5% now. But inflation has been markedly stronger than that – 3.2% on the latest reading."
The "latest reading" was taken in October. The November "reading" is even higher, with the CPI now at 3.3 percent and the RPI at almost 5 percent.
According to Mr. Bean, the higher inflation rate was due to three factors. The first two are old favourites - energy prices and the sterling depreciation. Well, if the Bank of England allows the currency to depreciate, then higher import and fuel prices is inevitable.
However, the third excuse was the most intriguing. Here is how Mr. Bean put it:
The third potential ingredient behind higher inflation is a more moderate drag from the margin of spare capacity in the economy. Pay growth has been subdued during the recession, and that has helped to ensure that unemployment has risen far less than many commentators feared. Rather the puzzle is on the pricing side, as prices have been higher relative to costs than expected. That could indicate that the margin of spare capacity is not as large as the collapse in activity might suggest.
What does this mean? For the last three years, the Bank of England had assumed that the financial crisis had created enormous spare capacity within the UK economy. The lack of credit had prevented consumers from spending and firms from investing. This meant that unemployment rose and factories were operating at levels far lower than during the pre-crisis days. In principle, this should have limited the potential for higher inflation.
Furthermore, there was a danger that the price level might actually fall. This would worsen the balance sheets of the private sector, making a recovery more difficult. It was this fear of deflation that prompted the Bank of England to begin quantitative easing.
The inflation rate was working with another script. Rather than moderate, the rate has for most of the last three years remained stubbornly above the Bank of England 2 percent target.
As Mr. Bean's speech testifies, the Bank of England are now considering the possibility that, contrary to earlier assumptions, the economy may actually be operating closer to full capacity than previously thought. Therefore, any further attempt at boosting activity, such as a further splurge of quantitative easing, will feed through into higher inflation.
Many in the Bank are harbouring two conflicting thoughts. Capacity may be tightening but the current inflationary spurt is still regarded as temporary.
This is how Mr. Bean explained it:
Ultimately, however, this period of elevated inflation should prove temporary. The standard rate of VAT is set to rise again at the beginning of next year, but once that drops out of the annual comparison a year later, so the inflation rate is likely to fall back sharply. The impact on prices of sterling’s past depreciation should be starting to wane. And the relatively moderate expansion that we expect over the next year or two should ensure that there is some, albeit uncertain, brake on inflation from spare capacity.
This statement reeks of self-doubt. With inflation well above target, and the economy approaching its supply limits, the sensible thing would be to raise rates. Despite the clear and alarming trends in the inflation numbers, the Bank of England isn’t quite ready to move.
The November inflation number - much worse than expected

The November inflation numbers were really quite shocking. The headline 12 month CPI increase was 3.3 percent, while the retail price index increased by 4.7 percent. The underlying trends suggest that inflationary pressures are growing very rapidly.
Here is a breakdown of the monthly change in the main price categories.
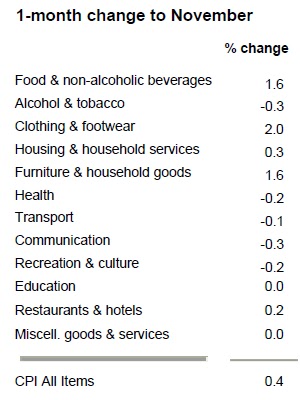
The change in food and non-alcoholic beverages prices was the most alarming. Overall, this category rose by 1.6 per cent, the largest ever rise for an October to November period. The biggest increase came from fruit where prices rose by an eye-watering 7.5 per cent.
Clothing and footwear prices also increased sharply, recording a 2.0 per cent monthly change. Again, this is a record rise for an October to November period. Furniture, household equipment and maintenance also showed a record rise for increasing by 1.6 per cent. If these monthly rates were annualized, then we would be looking at double digit inflation rates.
It is now about a year and a half since the Bank of England started printing cash. Normally, it takes about 18 to two years for the effects of a monetary shock to feed into inflation. The latest data illustrates that he effects of quantitative easing are now being felt very much as one would expect.
As the old man of monetarism - Milton Friedman - once said, "inflation is always and everywhere a monetary phenomenon". He is being proved right once again here in the UK.
Tuesday, 14 December 2010
Scotland - why have you become so naughty?

Sociologists hate talking about long term crime statistics. This is because to the casual untrained eye, the numbers strongly suggest that people have become much more evil. However, that kind of simplistic approach to complex social phenomena runs the risk of marginalising a lot of academics.
Take, for example, Scotland. The quasi-independent statelet publishes crime data going back to the 1930s. Since then, reported crimes and offenses have grown 800 percent. Only UK house prices have grown faster.
The data tells a strange story. Crime peaked in 1938, and fell with the onset of the war. Afterwards, it remained broadly flat until the early 1960s. Then, a diabolic wave of criminality began to wash over the land. Crime began to rise exponentially, reaching over a million incidents in the early 1990s.
Then things got really weird. After nearly thirty years of smooth steady increases, the numbers started to jump around erratically. One year, Scotland would be good, and crime would fall. The year after, it would return to its odious criminal ways.
Over the last five or so years, Scotland has been overwhelmed by a flood of righteousness; crime is on the way down, although it has some way to go before it returns to the pre-1960s levels.
So, what is behind the shocking rise in naughtiness in Scotland. Remember, in secular Britain there is no such thing as evil people, only evil institutions.
So based on various highly informed discussions with academics, here are my top ten explanations for the rise in criminality. If I missed any theories, then please let me know.
1. Population growth - True, there are 15 percent more people living in Scotland than in the 1950s; but that leaves 785 percent of the increase unexplained.
2. Increasing wealth - Scotland is richer, and there are more things to steal.
3. More Police - This is a criminal version of Say's Law. Supply creates its own demand. The supply of police increases, therefore the demand for their services also increases. Since the primary activity of the police is recording crime, the rate is bound to go up.
4. Insurance claims - More people have insured their goods. When they get stolen, they are required to inform the police.
5. The telephone - It is now easier to report crime. There is no need to go to the police station. Instead, you get on the blower, call 999, and the police come to you.
6. Better reporting - The police now have computers, printers and Internet connections. It is quicker to file a report and therefore more crime is reported. On a related vein, the Police in the past had an incentive to report crime, since the higher the crime rate, the greater the amount of over-time.
7. Drugs - If only society legalized puff, then people would buy their spliffs at the corner shop rather than breaking in, robbing the till and paying a bloke down the pub.
8. There are now more offenses - Every newly elected government feels compelled to make new laws. There are now more crimes on the statute book. Logically, it must follow that there are offenders.
9. Cheaper alcohol - Drink makes people daft. The price of beer is down, people drink more and therefore and they commit more crime.
10. TV crime shows have broadened the horizons of criminals. It has provided a valuable source of new ideas, allowing innovation and technical progress within the crime creation industry.
Alternatively, you might go for a decidedly nonacademic and unsociological explanation, pointing to declining morality, family break-down and the remorseless rise of an unemployable underclass.
Monday, 13 December 2010
Benefits reform - it isn't easy

(Click on the table for a larger presentation)
Last fiscal year, social expenditure in the UK amounted to £141 billion. You might think that this is a monstrously large figure in desperate need of being reduced.
It isn't so easy. At least half of it goes on pensions expenditures (state pension, pension credits and winter fuel payments). Housing benefit takes up around £20 million. Everything else is, comparatively speaking, small change.
Benefits expenditure has also been growing rapidly in nominal terms. Since FY03, most benefits have increased by well over 50 percent. Even allowing for the embedded inflationary component, this is an astonishing rate of growth.
The central problem is population ageing. Within the next 15 years, pensions expenditure will start to rise very sharply. At the same time, the number of active workers available to pay taxes and finance this expenditure will fall.
Even if the government hauls back expenditure on non-pension items such as housing benefit, the growth of age-related expenditures will quickly eat up those savings.
Benefits reform - good luck with that.
Sunday, 12 December 2010
The British Isles greatest export....

UK migration trends have been remarkably stable over the last decade.
Apart from a little dip in 2008, the financial crisis has had little impact on flows. Contrary to widespread and alarmist predictions, our friendly Polish plumbers have not returned to fix the dilapidated piping in Warsaw.
The numbers tell a straightforward story;
- Every year around 500,000 people migrate to the UK:
- At the same time, over 300,000 people leave:
- The net population increase is somewhere between 150,000 to 200,000 a year.
People have been, by far, the greatest export from these fair isles.
The Euro is Europe
"We will defend the Euro, because the Euro is Europe. Our determination, both German and French, is total."
Nicolas Sarkozy, after his recent meeting with Angela Merkel
When politicians begin to talk of "defending currencies", the end is not far away.
Alice Cook, after her recent meeting with her ATM machine.
Nicolas Sarkozy, after his recent meeting with Angela Merkel
When politicians begin to talk of "defending currencies", the end is not far away.
Alice Cook, after her recent meeting with her ATM machine.
UK inflation number is out this week
So what is it going to be? Will the rate crawl below 3 percent? I think not.
Saturday, 11 December 2010
A primer in US healthcare
In 1984, Three quarters of Americans had health insurance. The private sector covered the bulk of these people. Medicare; a federal health insurance system, provided coverage for retirees.
By 2007 , this coverage had fallen to two thirds. In other words, one American in ten had lost their access to health insurance. Since Medicare coverage was growing, private provision was declining dramatically.

Did the number of people without any health coverage increase? Only fractionally. The number of people without any health coverage increased in the mid-1980s, but subsequently remained broadly constant. Around 16 percent of Americans have no health coverage.

The proportion of Americans covered by the public health care system - Medicaid - is up by almost 10 percentage points. Medicaid provides health care for families with low incomes and resources. It is a means tested program that is jointly funded by the state and federal governments, and is managed by the states.

Rising expenditure on Medicaid and Medicare is putting severe pressure on public sector budgets. Overall, the US spends about 16 percent of GDP on health care. Public spending accounts around a half of that number.
Although government programs accounts for half of all expenditure, it actually only provides coverage for directly for 28 percent of the population, who are basically the very poor and the old.
Here is the kicker; health care costs for these groups can only increase. The reason is due to the lifecycle dynamics of health care.
For the vast majority of people, health care costs follow a standard pattern. For three score and ten years, they are healthy, and have little need of doctors. As we approach the end of their lives, people contract an ailment that will eventually kill them. At this point, individual health care costs explode.
The poor, however, follow a slightly different pattern. Due to variety of poor lifestyle choices, they tend to be ill with chronic diseases over longer periods. The poor, it is sad to say, require more health care than the middle classes.
With population ageing and a deeply entrenched and growing underclass, the US government finds itself forking out ever increasing amounts on health care.
The US health care system is simply unsustainable. Yet with each reform initiative, it moves closer to the thing that most Americans want to avoid; a fully public system.
Output price inflation running at 4 percent a year

The UK economy may have slowed to a crawl, but inflation is a problem that just won't go away.
The output price index for home sales of manufactured products rose 3.9 per cent in the year to November. If the essentials of life are excluded - Food, Beveridges, Tobacco and Petroleum (FBT &P) - the rate of output inflation declines slightly.

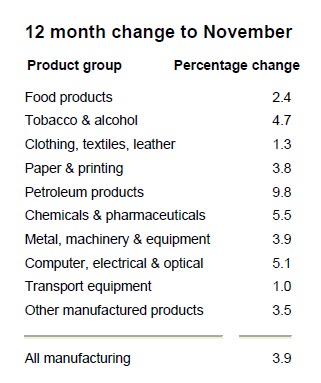
Do you think that the Bank of England actually care about inflation anymore?
US mortgage delinquencies - the horror continues

There are now 2.5 million American mortgages in foreclosure. The Home Affordability and Stability Program has slowed the pace of eviction. However, the number of mortgages in arrears over 90 days continues to rise remorselessly.
With the army of distressed home owners growing remorselessly, the US property market has yet to trace out a bottom. House prices are down 30 percent from their peak, and continue to slide southwards.
Behind this chart is a mountain of misery. The vast majority of those foreclosures involved honest American families losing their homes.
I am starting to feel sorry for bankers
An Irish Socialist in America; bad language and bucket of blame thrown on the heads of hapless bankers. There will be a temptation to cut this joker off but it is well worth watching this thing till the end.
I know I've done my share of finger pointing, but I am beginning to wonder whether a little more personal responsibility might be in order.
Happy Madoff day

It has been two years since the moneyed maestro of Manhatten was arrested.
Such a charming man.
Friday, 10 December 2010
How Gordon Brown saved the Euro
Poor old Gordon Brown; six months ago he was Prime Minister and sometime saviour of the world. Today, he is reduced to writing op ed articles in the FT.
Sadly, there is no link to Gordon's thoughts. The FT operates an impenetrable pay-wall. However, his article can be summarized in two short sentences. First, he was against Britain's participation in the Euro. Second, it is in no one's interest if the euro should collapse.
His second point is certainly debatable. For example, Ireland may well be better off if the Euro were to disintegrate.
On the first point, Gordon is almost certainly telling the truth and he has the track record to prove it. More than anyone else, he deserves the credit for keeping the UK out of the single currency.
In 1997, He cleverly created those "five economic tests", which provided a technocratic barrier that the Euro-capitulators could never overcome. That Brown-inspired nonsense was sufficient to keep the UK from the clutches of the ECB and monetary disaster.
Consider, for a moment, the counterfactual. Suppose that Gordon had been unable to persuade Blair, Mandelson and the other Europhiles from bringing the Euro to these fair shores. Suppose Britain had adopted the Euro in 1999 - what would have then happened?
The first 10 years of the Euro were marked by unreasonably low interest rates, which generated massive housing bubbles in the eurozone periphery such as Ireland, Spain, Greece and Portugal. The UK would have suffered a similar fate, which would have made the bubble we did have, look like a minor blip. With exchange rate risk eliminated, a tidal wave of capital inflows would have drowned our banks.
With cash pouring into the UK, and no independent central bank to hold back the flood, our reckless and largely unsupervised banks would have gone mad. They would have given out credits to anyone warm enough to hold a biro in their hand and sign a loan application. House prices would have hit the stratosphere and when it would have all ended, the UK banking system would have crashed as if it were the day before Armageddon.
Bailing out Ireland and Greece is one thing, but covering up the losses of a Euro-driven British housing bubble would have been impossible for EU. An exit from the Euro would have been the only sensible thing to do. As soon as any sensible government were elected, they would have pulled out immediately. This would have provided the necessary cover for Greece, Ireland, Spain, Portugal, and Italy to leave as well.
By keeping the UK out of the Euro, Gordon gave the single currency a chance of survival. Keeping the pound was definitely good for Britain and its capacity to absorb the shock of the financial crisis. But it was also good for the Eurozone.
Today, there is no one in the UK who would seriously argue that Britain should join the Euro. Even those Euro-fanatical Lib-Dems have quietly dropped their support for the single currency. If there were a referendum today, only Peter Mandelson and his Brazilian man-wife would vote yes to Euro membership.
So well done Gordon. Good call. It is pity that the rest of your time in office wasn't marked by such wisdom and foresight.
Still overpriced

The bubble may have burst, but property still looks overvalued when compared to average earnings. Currently, the ratio of house prices to incomes stands at 4.6. The historical average, which includes the recent bubble, is more like 4. A reasonable ratio would be something closer to 3.
Thursday, 9 December 2010
Private versus public sector wage rates

This chart looks at the distribution of wages across the private and public sectors by percentile. On the left hand side, we have the lowest paid ten percent along with their weekly salary. On the far right hand side, we have the highest 10 percent (denoted by the 90th percentile).
What does the chart tell us? It has a simple message; at every percentile except one, public sector workers are slightly better paid than their counterparts in the private sector. The only exception is the highest paid workers, where the private sector pays the highest rates.
A couple of warnings here. First, we aren't comparing similar occupations. The lower end of the public sector might cover highly trained graduates, whereas the private sector could include highly competent management trainees at McDonalds. Second, the private sector is signficantly larger and more heterogeneous than the public sector, despite New Labour's best efforts.
Still, the chart tells us something.
(data source: ONS)
The scandal of dental care in Wales

The NHS has just published its annual dental survey. The rest of the media might have missed it, but I read the report avidly. So, what is the state of the Nation's teeth?
- Overall, 94 per cent of adults in England, Wales and Northern Ireland were dentate (ie have some teeth).
- Over the last 30 years the proportion of adults in England who had no natural teeth ("edentate") has fallen by 22 percentage points, from 28 per cent in 1978 to 6 per cent in 2009.
- Eighty-six per cent of dentate adults had 21 or more natural teeth.
- The average number of teeth among all dentate adults was 25.6.
- Over three-fifths (61 per cent) of dentate adults said they attended the dentist for regular check-ups;
- Twelve per cent of all adults (who had ever been to the dentist) were classified as having extreme dental anxiety.
I say damn the deficit. More resources are needed in Wales to improve dental hygiene standards. So lets get some Dentists over there as soon as possible.
I am also quite worried about "Extreme Dental Anxiety". It is a malady that has not yet received an acronym, so I am going to invent one - EDA. So are you an EDA sufferer? I sense that the Welsh are particularly prone to EDA, hence the lack of teeth.
Wednesday, 8 December 2010
Women are catching up
The gender pay gap - the difference between median earnings received by men and women - has fallen from 12.2 per cent in April 2009 to 10.2 per cent in April this year. The decline is the largest annual improvement since the ONS started to properly record the gap back in 1997.
The reasons seems to be largely due to stagnating men's wages. Last year, men's earnings increased by only four pence, going from £12.97 in 2009 to £13.01 in 2010.
The hourly wage rate for women increased by a staggering twenty nine pence an hour. Last year, the median hourly rate was £11.39; this year it is £11.68.
The percentage changes reflect the underlying dynamics more clearly; men received a 0.3 percent median increase, while women's salaries went up by 2.6 percent.
Definitely good news for the girls, whose wages are more or less keeping up with inflation. A few more years like 2010, and women's wages could actually overtake those enjoyed by the hairy half of the population.
So what is going wrong, boys? However, I can't promise to spend much time thinking on that thorny issue; I am now off to Tesco. What can I buy with twenty nine pence?
My Australia Fund

Before the financial crisis, around 90 percent of current accounts paid interest. Now, only two thirds of accounts offer interest. With the bank rate sitting at 0.5 percent, even in those cases where banks offer something on a current account, the return is negligible.
Why the obsession with bank deposits and interest rates? My Australia Fund - my fifteen hundred quid that currently resides in NatWest - just keeps on losing value. I need every penny, and it irritates me enormously to think that I am being ripped off for the sake of keeping mortgage rates down.
Come on, Monetary Policy Committee, help me out a little. I need to get back to Marvelous Melbourne. Bondi is also calling me. And I never did get to Alice Springs.
Subscribe to:
Comments (Atom)